PRODUCTION / OEE / YIELD
Find the loss.
Follow the whole line.
Compare production against plan across work centres, processes and sites. Connect equipment losses with bottlenecks, quality and material consumption so the review explains what limited useful output.
CAPABILITIES
What it brings together.
01
Plans and constraints
Link plans with ERP records, capture operating constraints and follow job cards and route cards. Use current progress to review priorities and allocations.
02
Equipment and line effectiveness
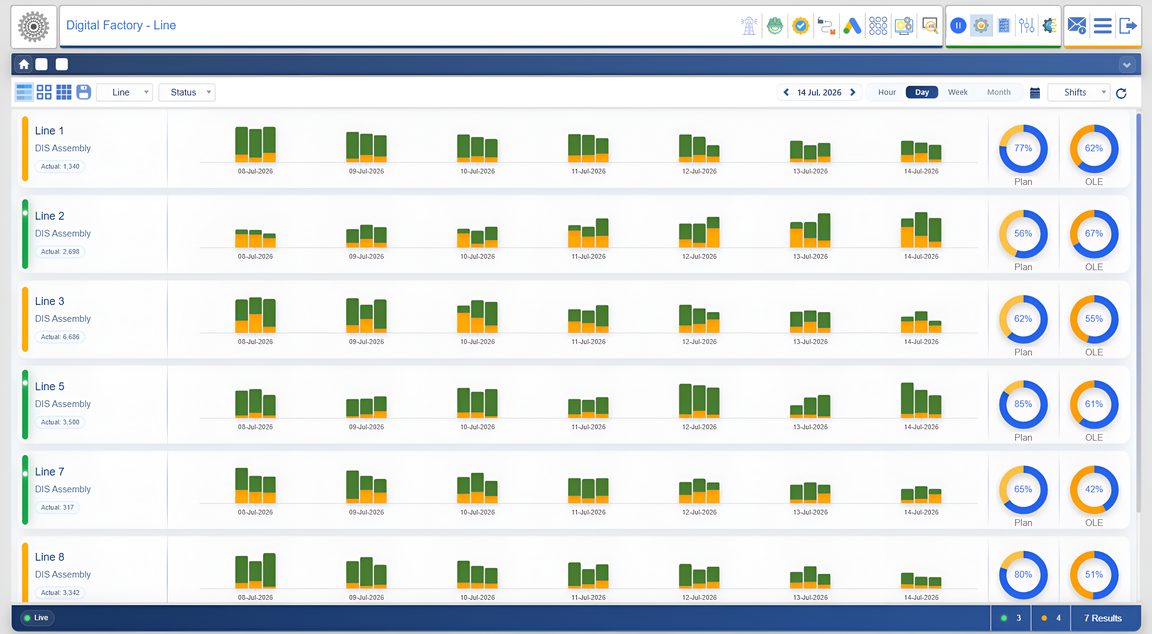
Read overall equipment effectiveness (OEE) through availability, performance and quality. Use overall line effectiveness (OLE) to widen the review to the connected line.
03
Material and yield
Connect material feeds, ERP bill-of-material checks and consumption records. Flag abnormal usage and examine process losses alongside production.
IN THE OPERATION
A busy machine can still feed a waiting line.
The output of a value stream depends on how its operations work together. A strong local result can sit beside a downstream queue, a material shortage or avoidable rework. StatPort connects live status, production trends and loss records, helping teams investigate the constraint rather than stop at the headline percentage.
- Track plan versus actual progress by work centre and process.
- Relate cycle-time losses to availability, performance and quality.
- Follow job and route records through a traceable operating history.
- Bring bottlenecks, process losses and abnormal consumption into one review.
A PRACTICAL APPROACH
Make the loss review lead somewhere.
Choose one recurring missed-plan or yield question. Agree the loss categories, record the operating conditions and connect the exception to the people responsible for the response. Follow up against comparable jobs and conditions so the team can see whether the action holds.
THE DAILY PRODUCTION REVIEW
Read the plan, the constraint and the material together.
Plan versus actual
The supplied productivity scope connects ERP plans with live constraints and reallocation decisions. Production status spans locations, work centres and processes, supported by digital job and route cards. That makes it possible to discuss progress through the value stream, not just the output of one machine.
OEE, OLE and losses
Cycle-time losses are linked to availability, performance and quality. Read equipment effectiveness alongside line effectiveness and the process constraining output. The dashboard should lead to an owned loss investigation, with the relevant job and operating context kept beside the indicator.
Yield and follow-through
Material-feed information and bill-of-material checks with ERP support the review of abnormal consumption and process losses. Agree the baseline and success measures for the pilot line. Client-reported improvements describe particular applications; they are not a guaranteed monthly result for a new installation.
CONNECTED THINKING
Keep exploring.
YOUR FACTORY. YOUR PRIORITIES.
Let’s connect your next step.
Start with your operating priorities. Explore the data, processes and people that can move them forward.