Explore StatPort dashboards, mobile views, Industrial AI and the architecture that connects them. Open a screen here, then follow the relevant product or solution.
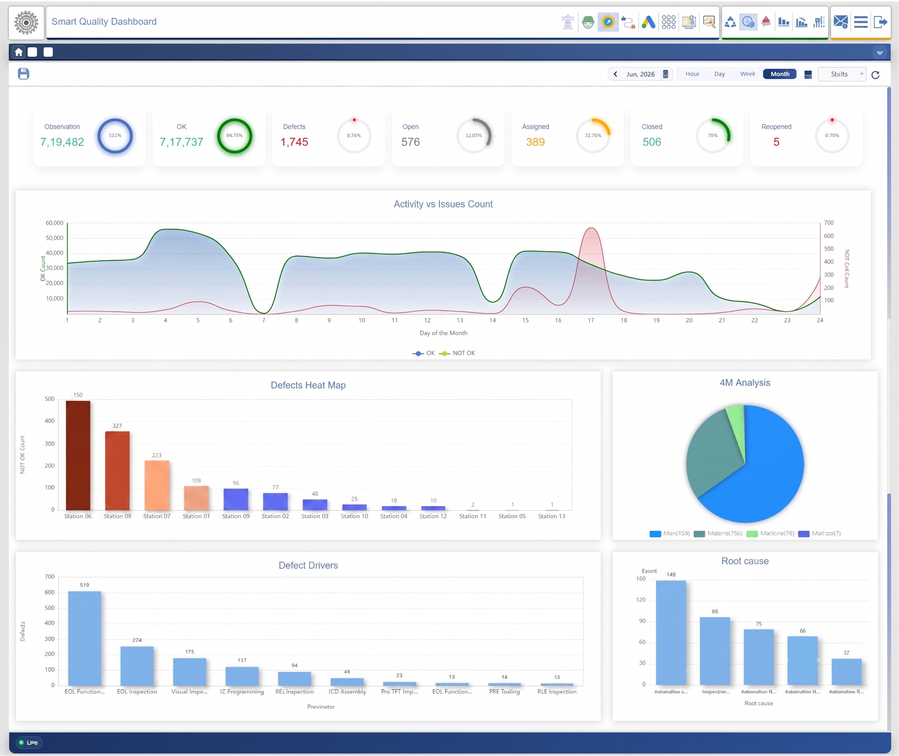
Smart Quality — process and defect reviewActivity versus issues, defect heat map, 4M analysis, defect drivers and root-cause views.
STATPORT, IN VIEW
Explore what the screens show.
Explore production, quality, mobile workflows and Industrial AI through the product screens below. Filter by capability and open a view without leaving the page.
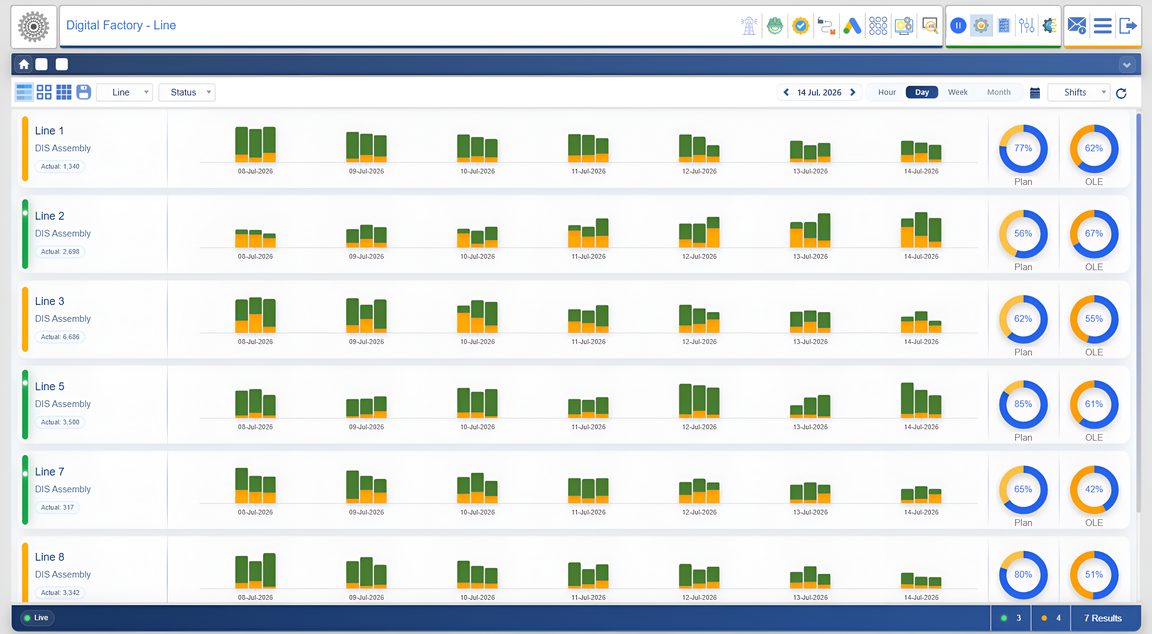
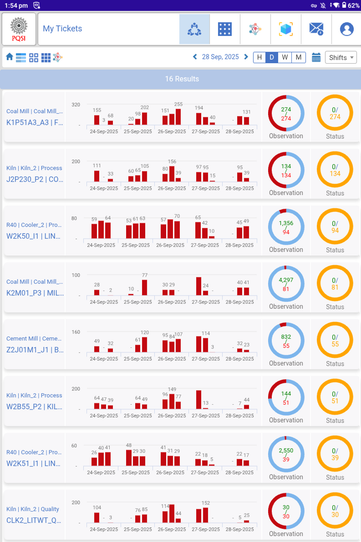
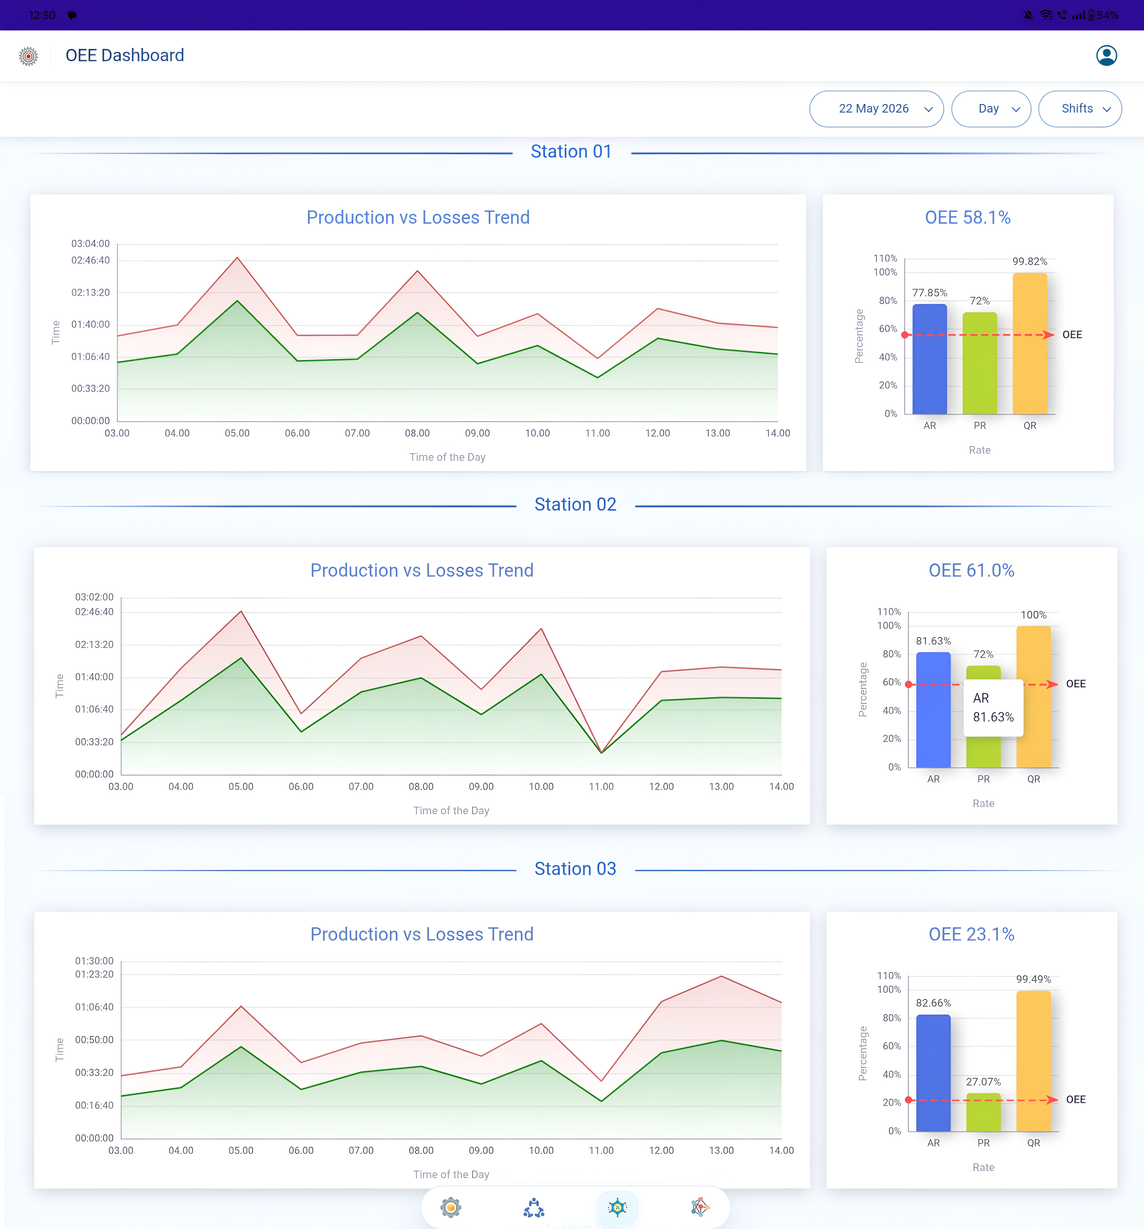
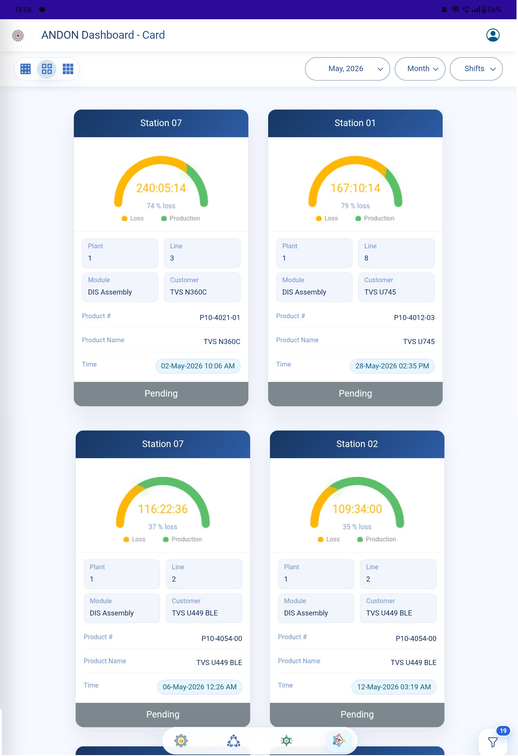
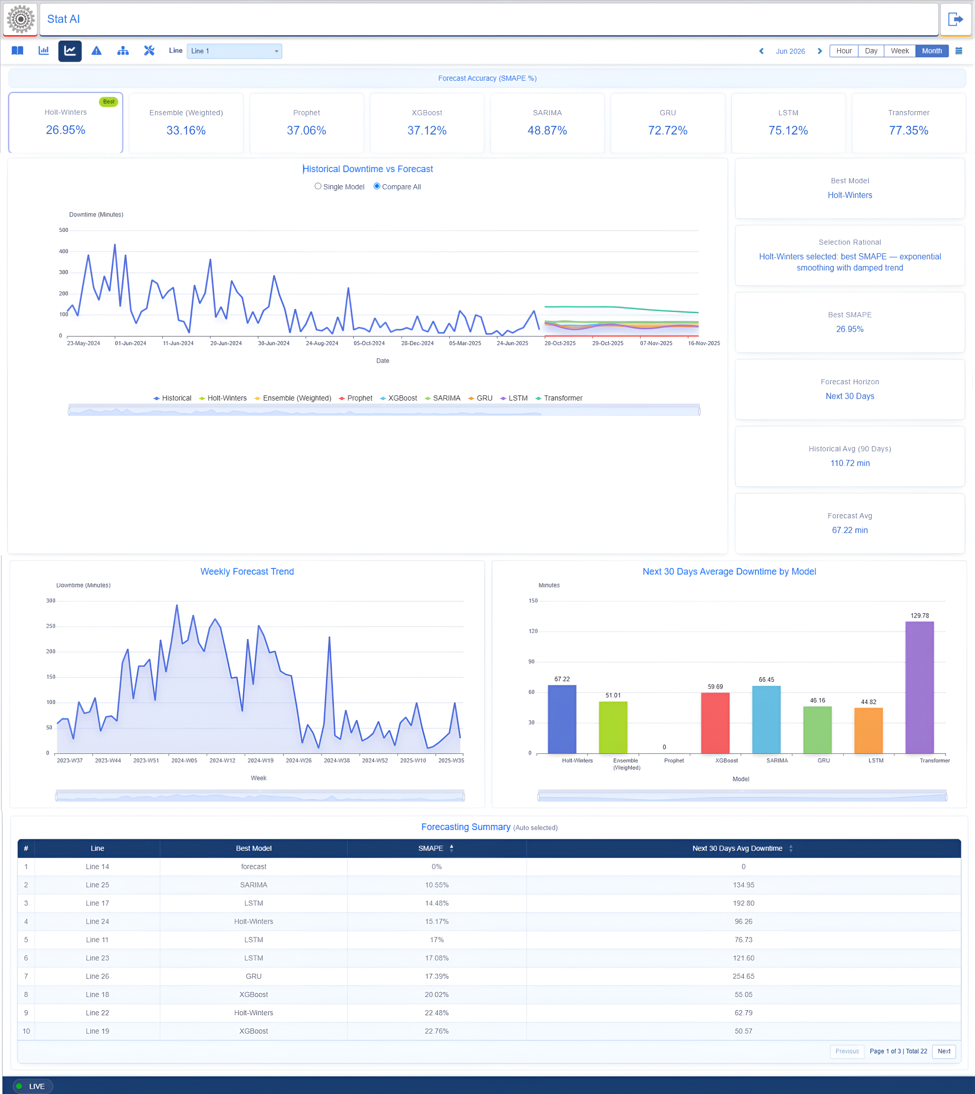
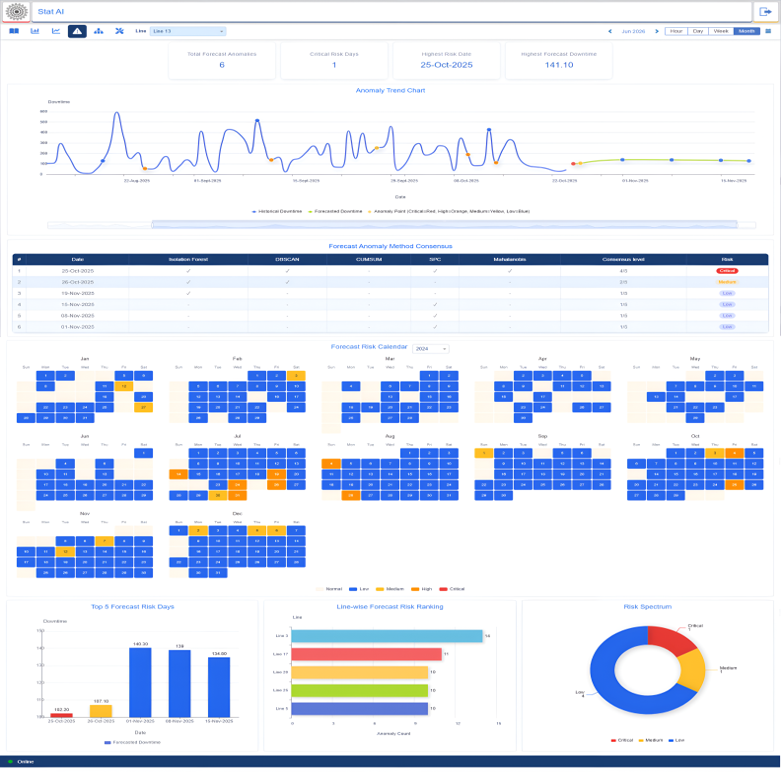
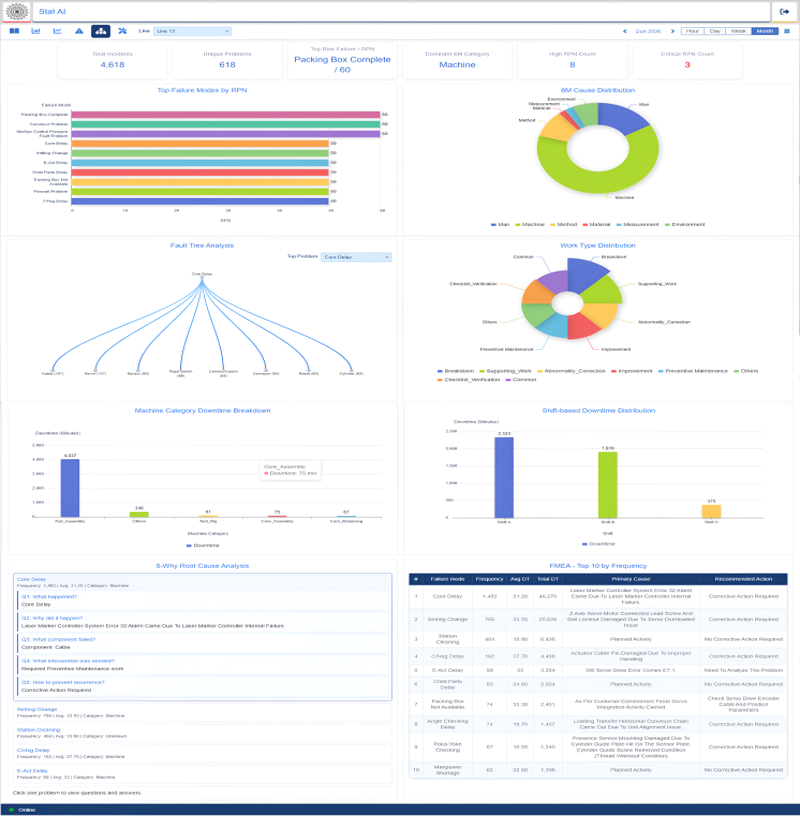
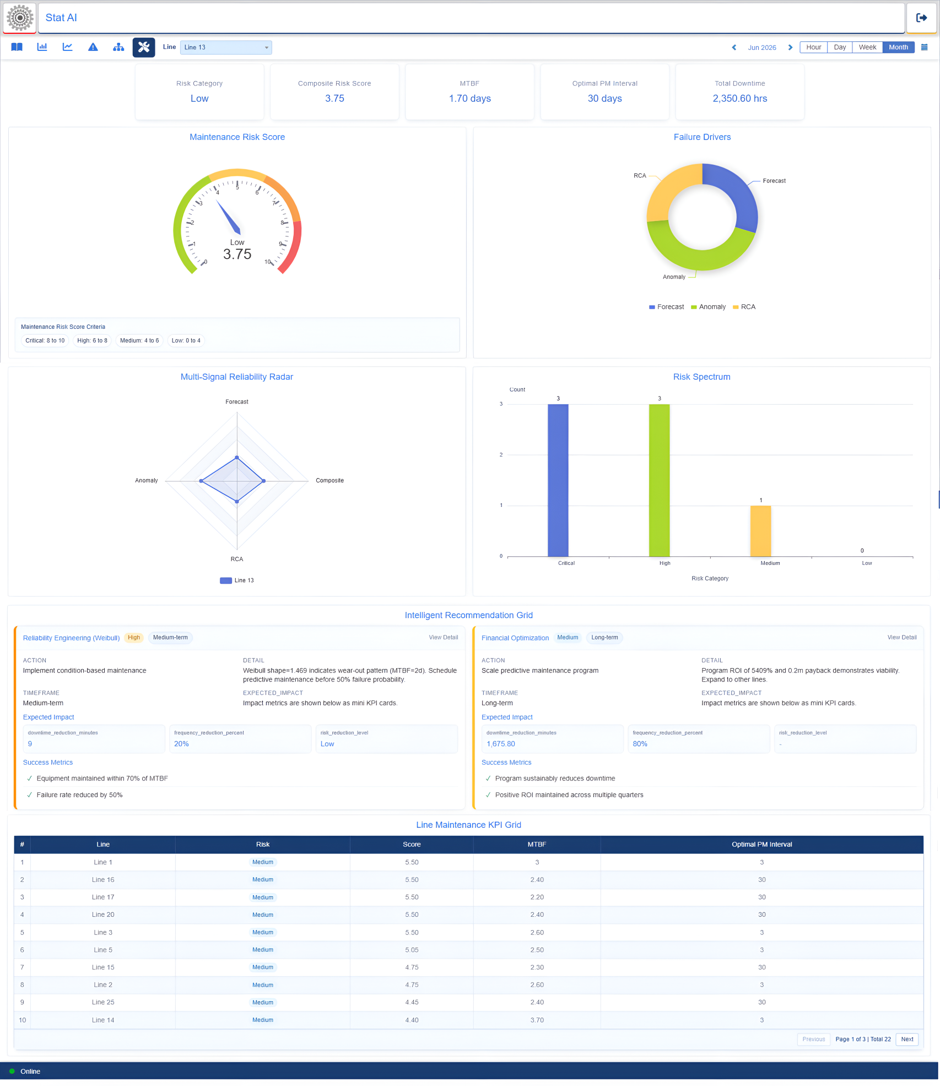
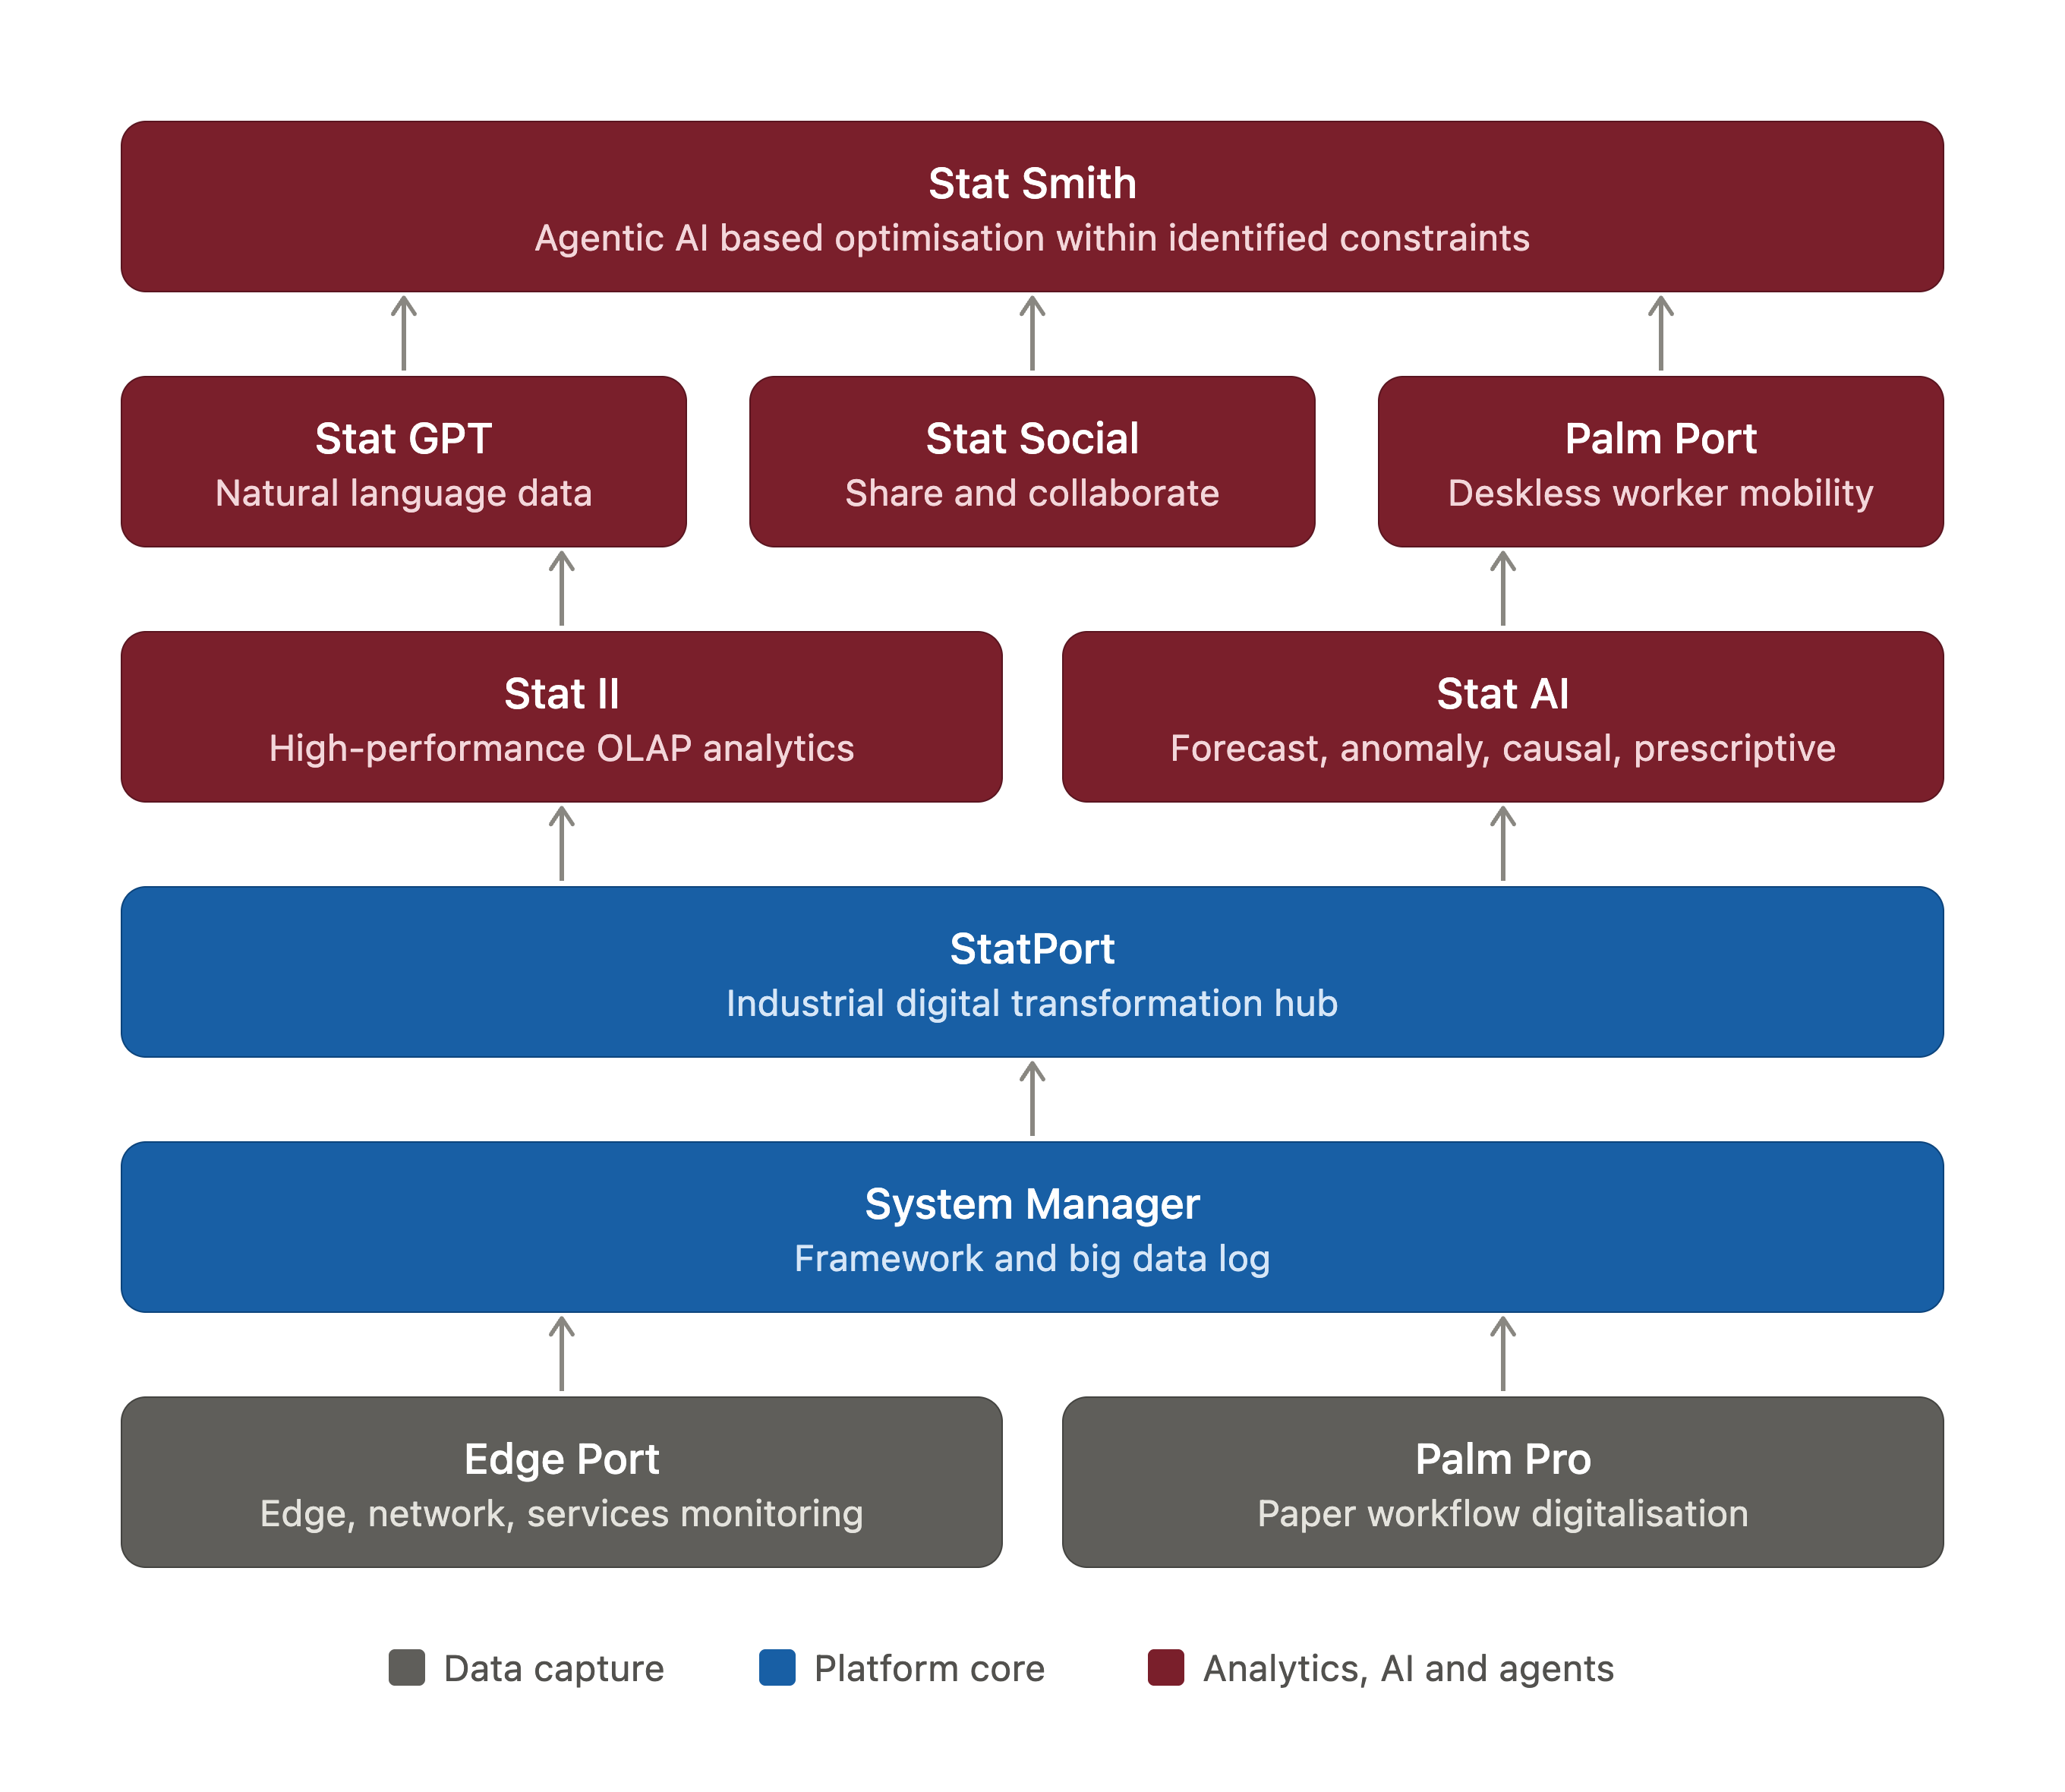
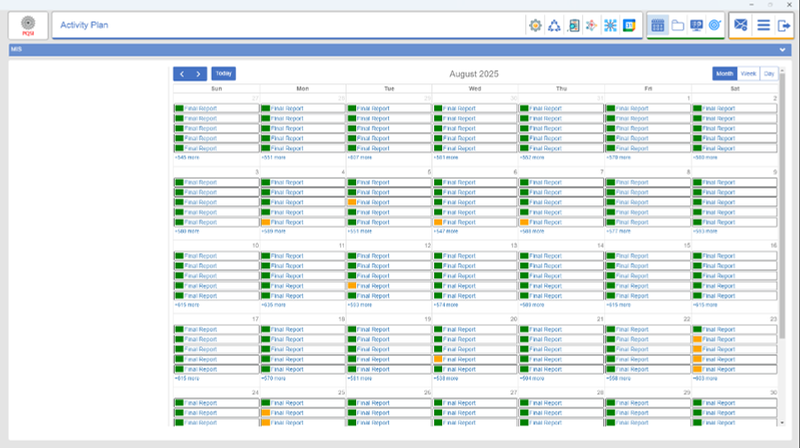
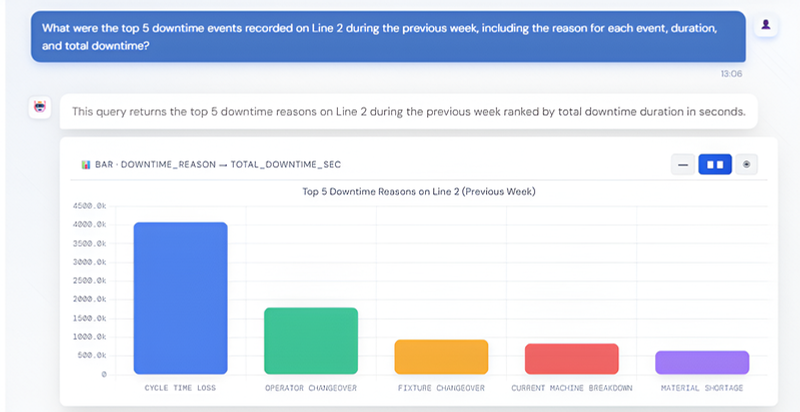
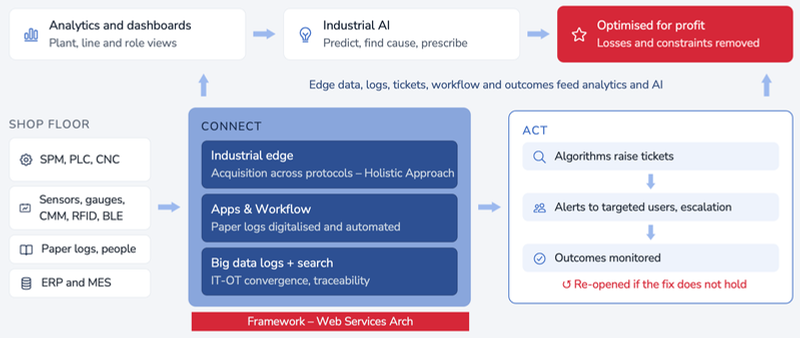
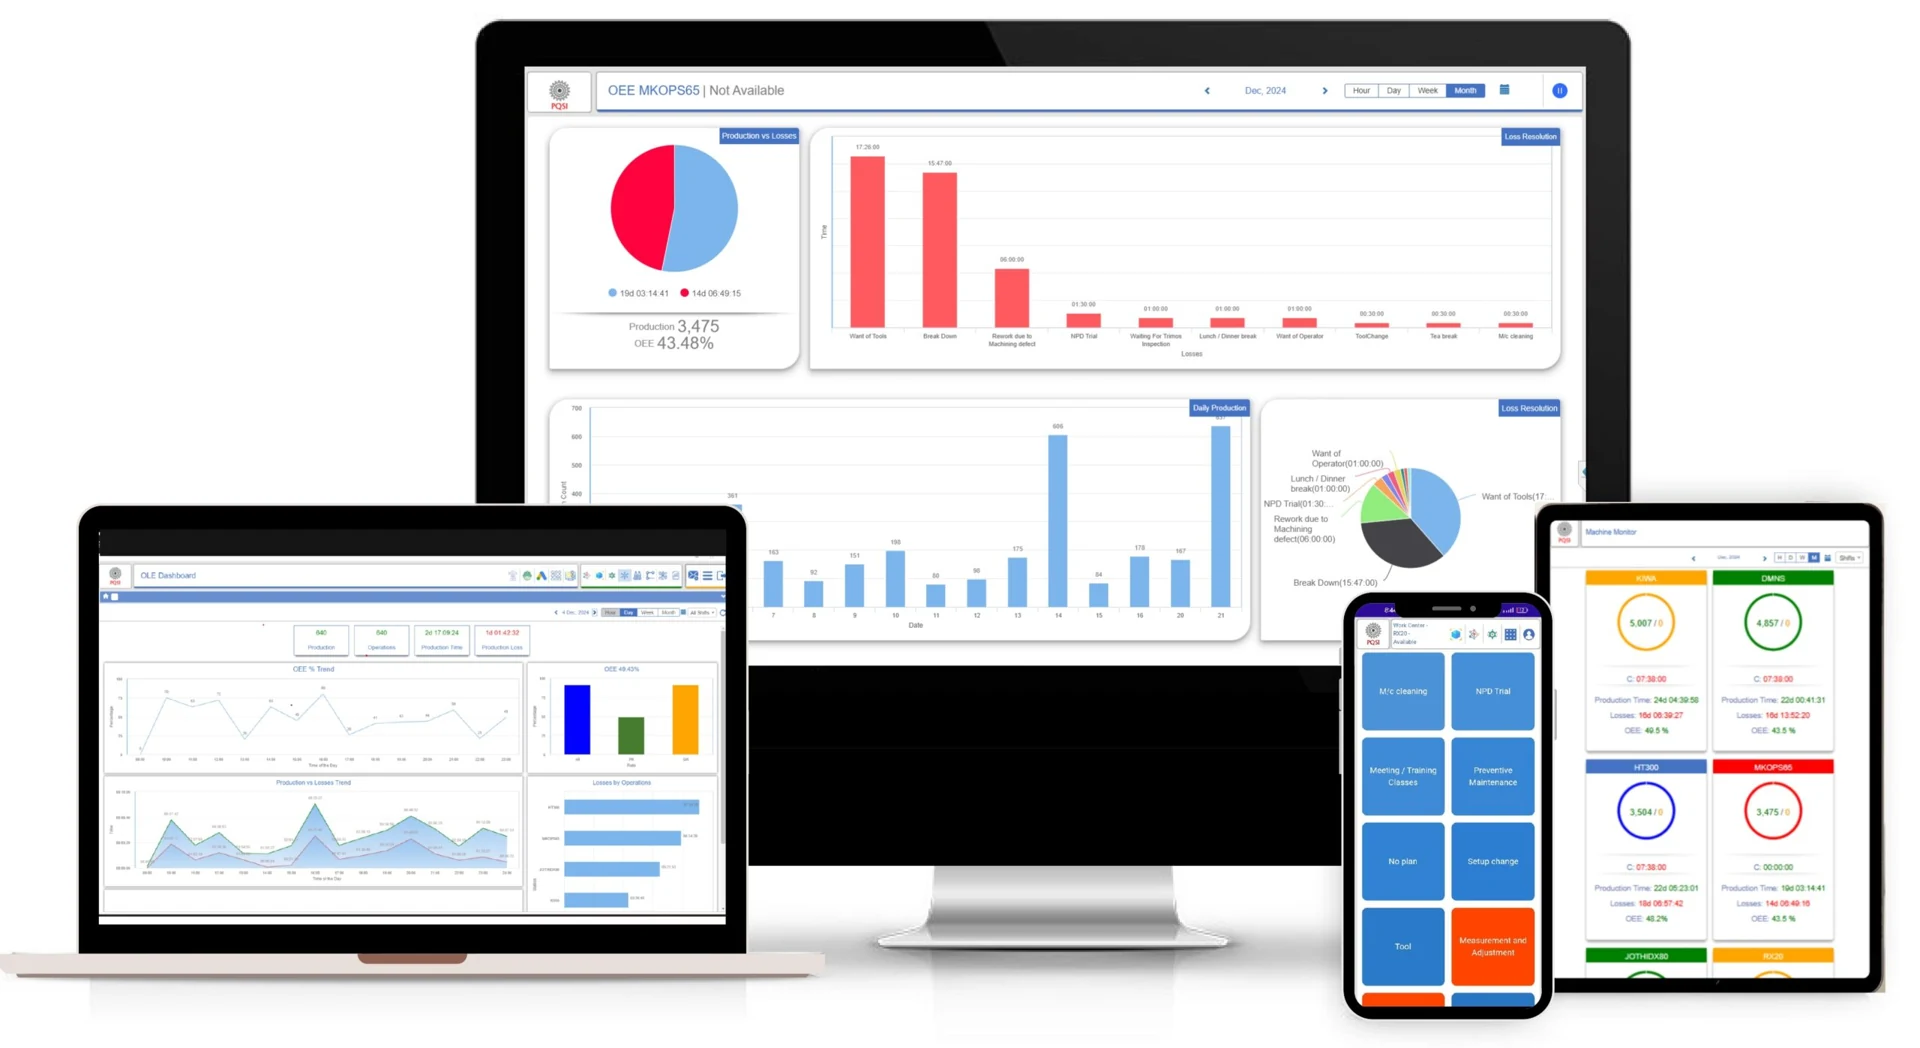
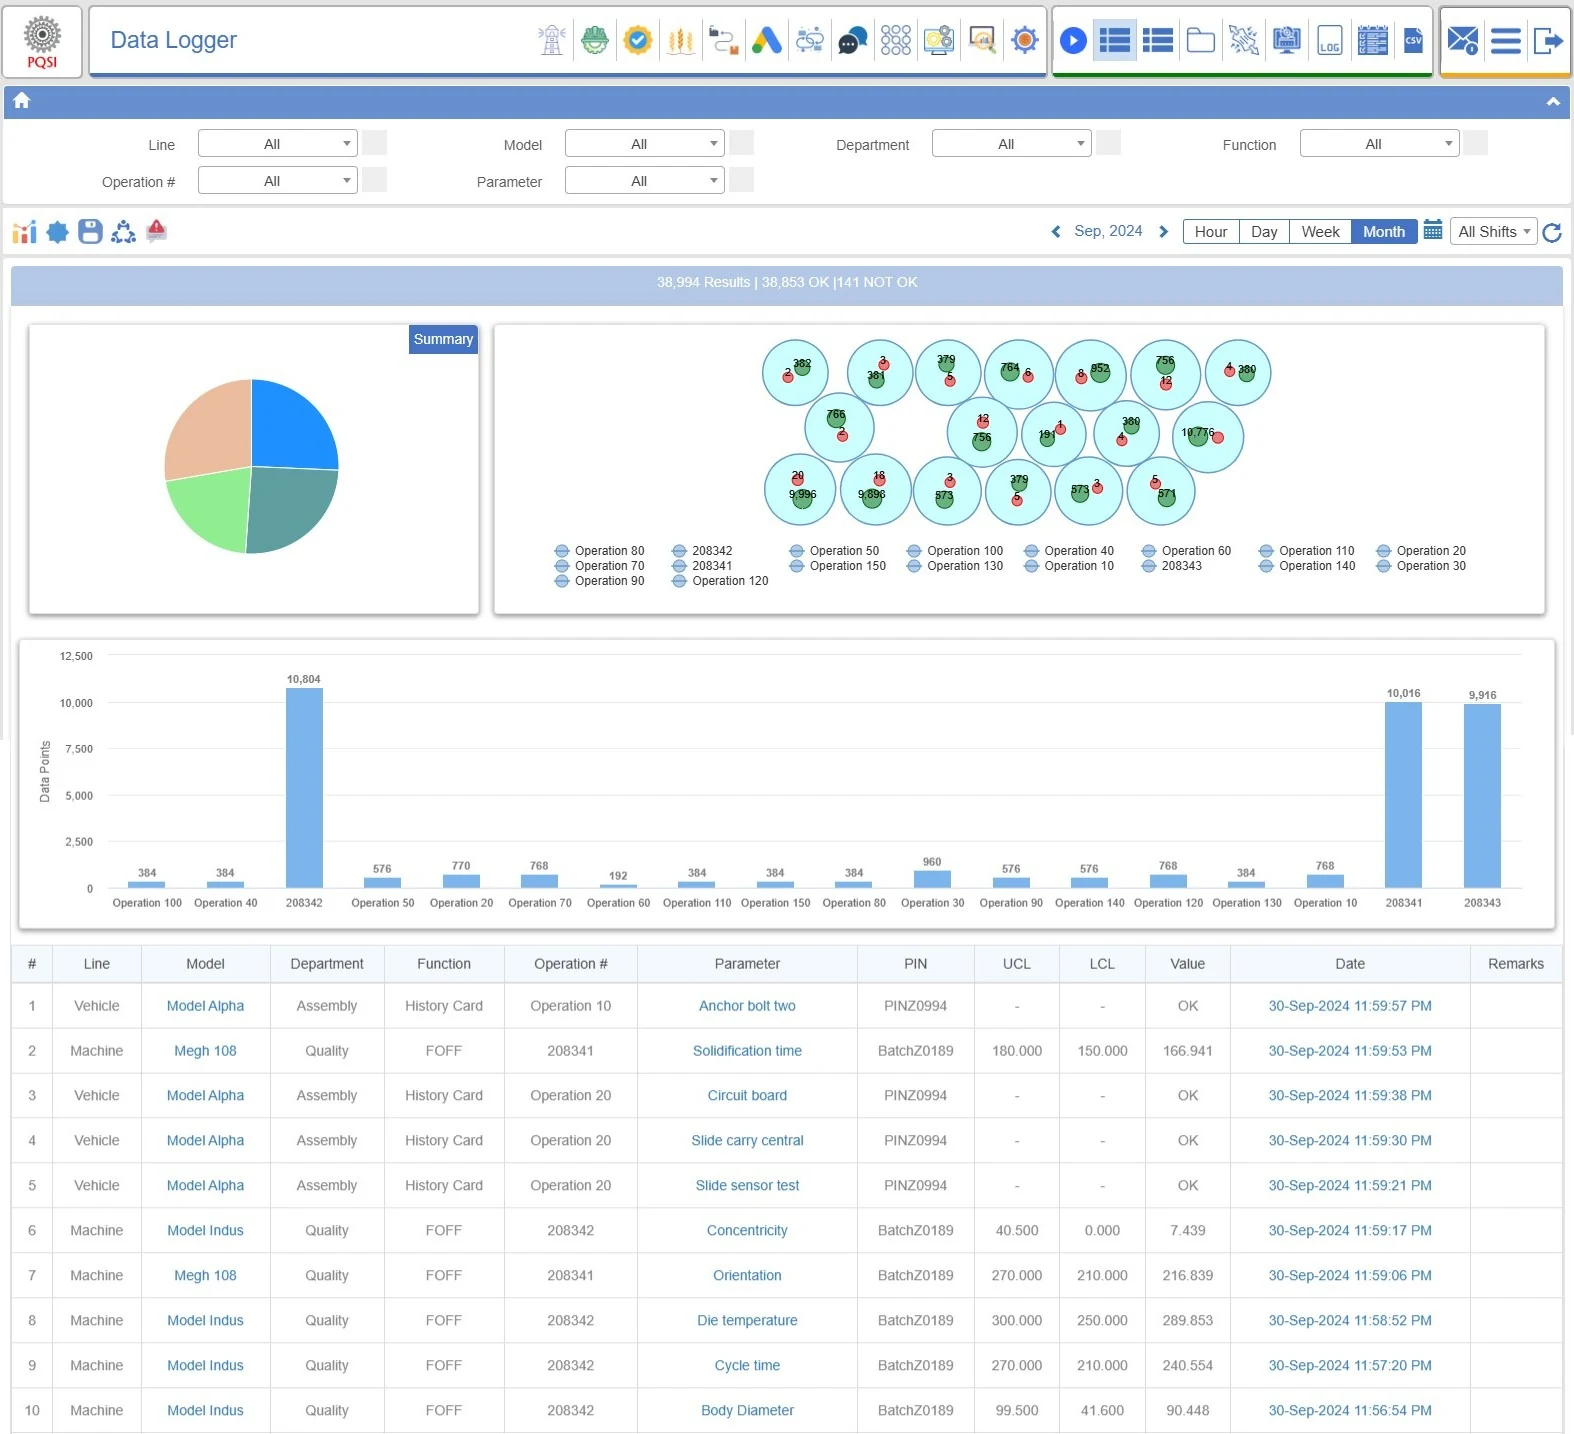
Digital Factory — line productivityLive line status, production trends and equipment/line effectiveness in one product view.DataSakshi · Product screenSmart Quality — process and defect reviewActivity versus issues, defect heat map, 4M analysis, defect drivers and root-cause views.DataSakshi · Product screenPalm Pro — process monitoringStation-level process tickets and performance indicators on the mobile application.DataSakshi · Product screenPalm Pro — station OEEProduction versus losses and availability, performance and quality across the stations shown.DataSakshi · Product screenAndon — real-time production monitoringStation cards, live production indicators and pending-work status.DataSakshi · Product screenStat AI — downtime forecastingHistorical data, forecast trend, model comparisons and the complete forecasting summary table.DataSakshi · Product screenStat AI — anomaly detectionMethod consensus, risk calendar and risk distribution views for an industrial-data investigation.DataSakshi · Product screenStat AI — root-cause investigationFailure-mode prioritisation, 6M causes, a fault tree, 5-why records and FMEA.DataSakshi · Product screenStat AI — predictive maintenanceMaintenance risk, MTBF, preventive-maintenance intervals and the recommendation grid shown in the deck.DataSakshi · Product screenStatPort — modular product architectureModular component map, read from data capture at the bottom to analytics and agents above.DataSakshi · Architecture diagramActivity calendar — scheduled industrial workScheduled activities and status in the industrial-workforce calendar.Stat GPT — a conversational analytics exampleA natural-language downtime question and a charted answer from the product interface.IT–OT convergence — the operating loopSources, Connect, Act, dashboards and Industrial AI in the operating architecture.StatPort across devicesDesktop and mobile product views across the StatPort family.Industrial data logger and analyticsIncoming industrial data records and analytical review.
ABOUT THESE VISUALS
Product evidence, with its context intact.
These product views and architecture diagrams show the StatPort family. Screen values illustrate the interface; they are not promised business results or evidence of a particular customer installation. The Industrial AI examples relate to the pilot-ready capability.
Use “Actual size” in the image viewer to inspect a chart or table, or return to “Fit to screen” for the complete view. Each product screen retains its original detail.