THE INDUSTRY 4.0 PLATFORM
One operating picture.
A clearer next step.
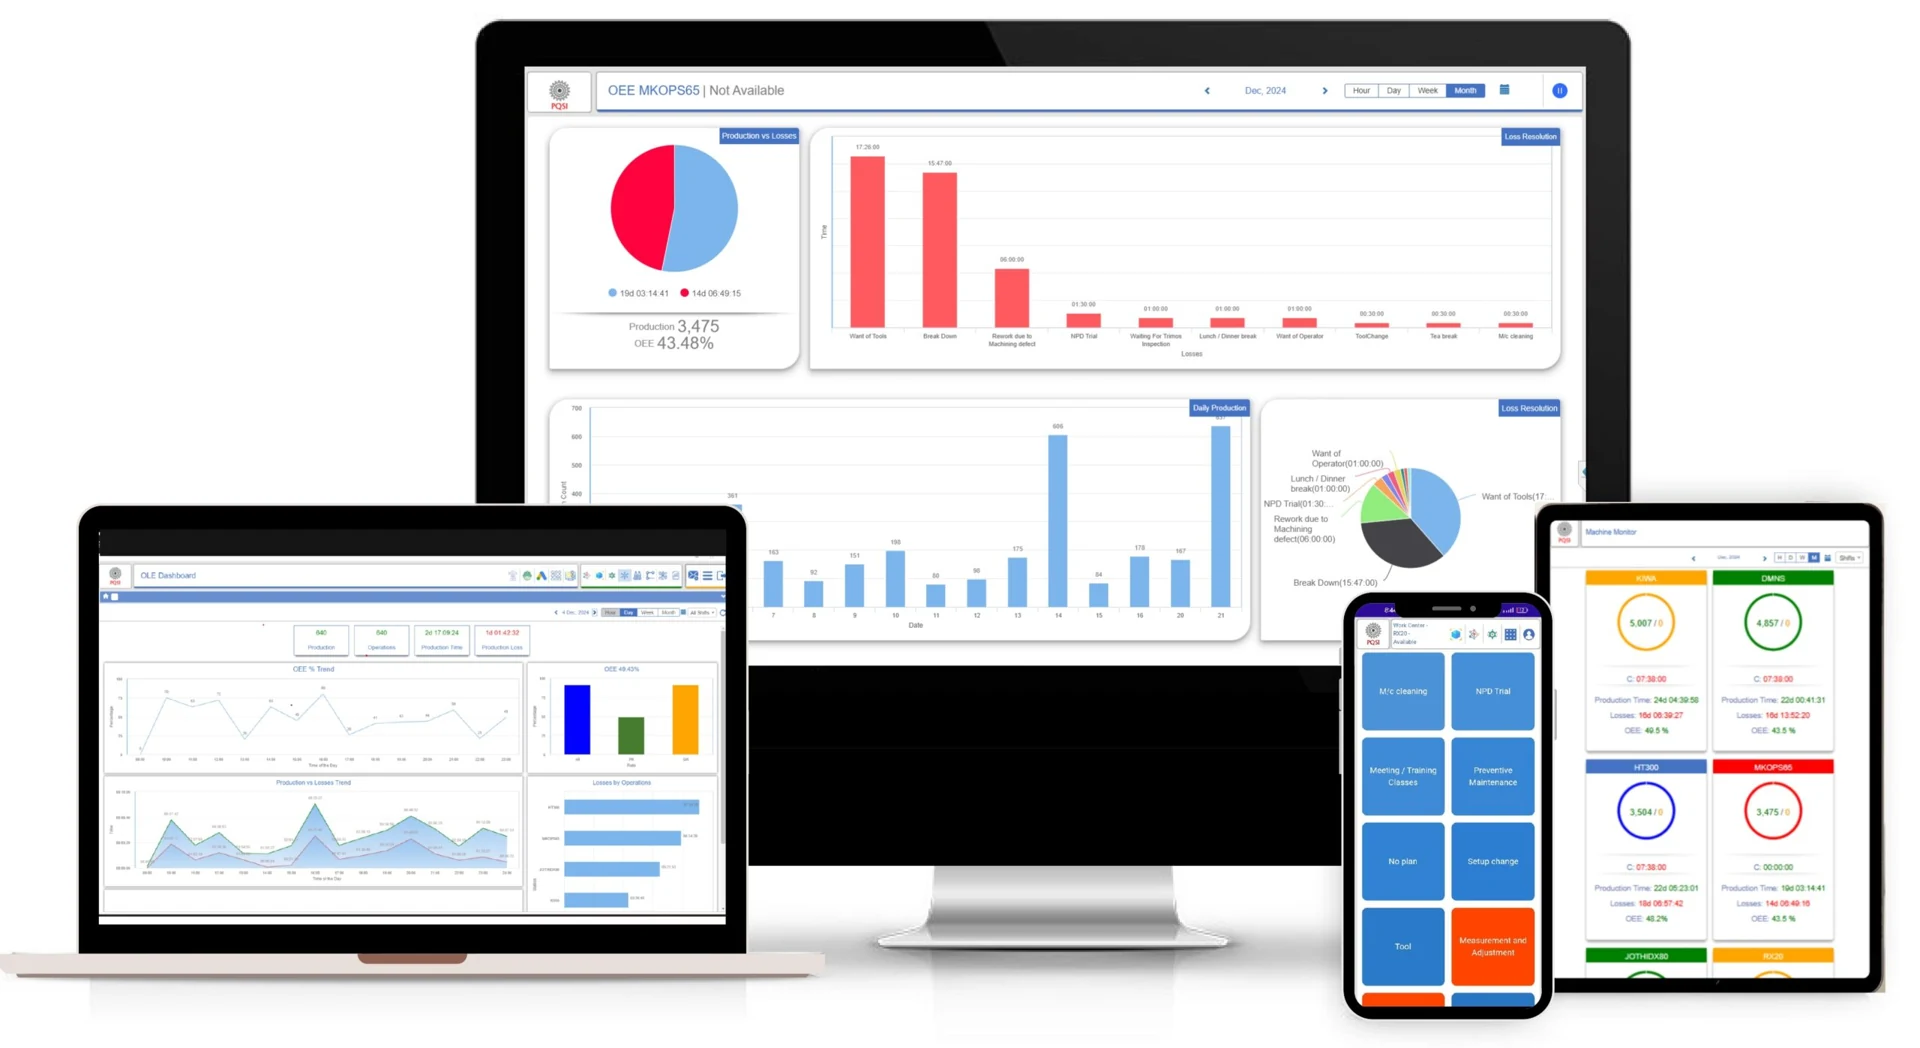
Your machines, quality records, ERP and shop-floor teams each hold part of the story. StatPort connects those sources so production, quality, maintenance and management can work from the same industrial record.
CAPABILITIES
What it brings together.
01
Connect the sources
Bring equipment signals, measurement data, digital forms and enterprise records into a common data foundation. Work with existing systems and the information held by people.
02
Understand the operation
Relate a reading to the job, process, asset and operating conditions behind it. Review plans, losses, variation and trends with the context needed to investigate.
03
Carry the action through
Turn detected issues into tickets and targeted alerts. Route work, escalate unresolved issues and monitor whether the corrective action continues to hold.
IN THE OPERATION
From a signal to a sustained response.
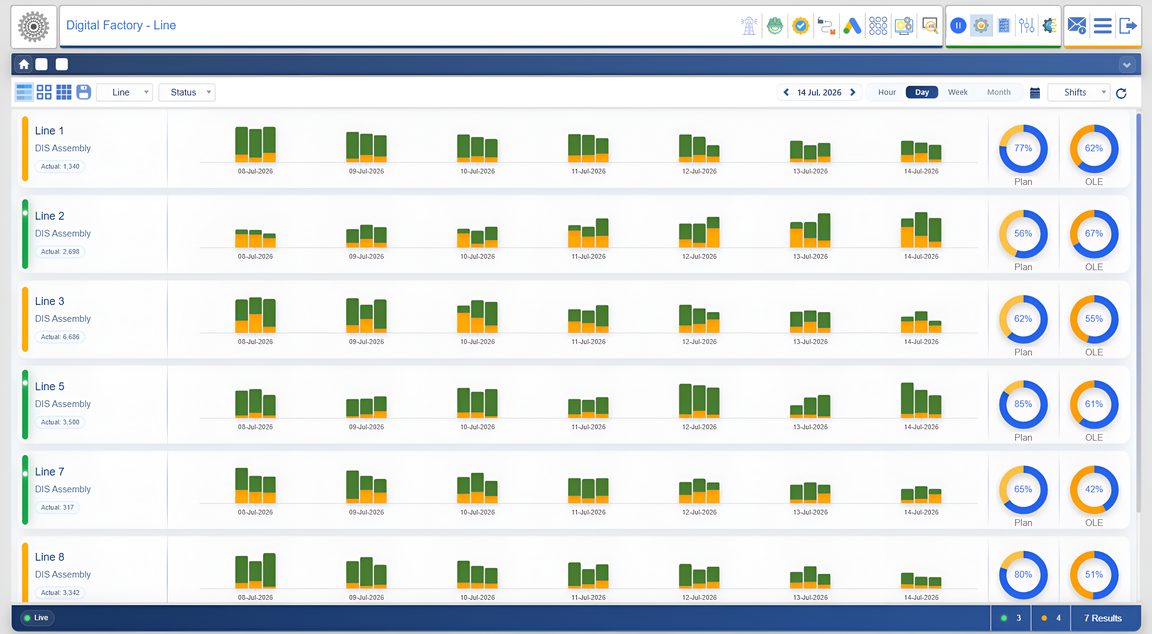
A dashboard can reveal a loss without resolving it. StatPort connects the steps around that loss: acquire the data, build a searchable record, identify the exception, assign the response and review the outcome. This is IT–OT convergence in practice—bringing business and human records together with data from operational equipment.
- Production against plan, cycle losses, bottlenecks and material yield.
- Quality measurements, process variation and traceable corrective actions.
- Maintenance schedules, downtime, calibration and asset history.
- Digital documents, workforce tasks, analytics and pilot-ready industrial AI.
A PRACTICAL APPROACH
Fit the platform to the plant.
Start with one value stream and a defined operating question. Map the available signals, paper records and ERP or manufacturing-system links, then agree the first application and its success measures. StatPort supports on-premises, hosted-server and cloud deployment approaches; the configuration follows the plant’s equipment, infrastructure and data requirements.
CONNECT · ACT · OPTIMISE
A working loop, not another isolated dashboard.
Connect the operating record
StatPort brings machine and gauge signals together with digital documents, people and enterprise systems. Industrial-edge acquisition and apps feed data logs that can be searched and related to the operation. This gives production, quality and maintenance a shared starting record rather than separate versions of the same event.
Turn attention into a response
The supplied architecture describes algorithms that raise tickets, targeted alerts with rule-based escalation and monitoring of the resulting action. A ticket can be reopened when the outcome does not hold. The point is to keep the event, the responsible person and the follow-up connected.
Build the next layer from that foundation
Plant and role-specific dashboards bring the connected record into operating reviews. Industrial AI builds on the same foundation for forecasting, anomaly detection and investigation. Begin with an Assessment for Industry 4.0, prove a defined application on one line and use that evidence to plan wider adoption.
CONNECT · ACT · OPTIMISE
Nine layers. One operating loop.
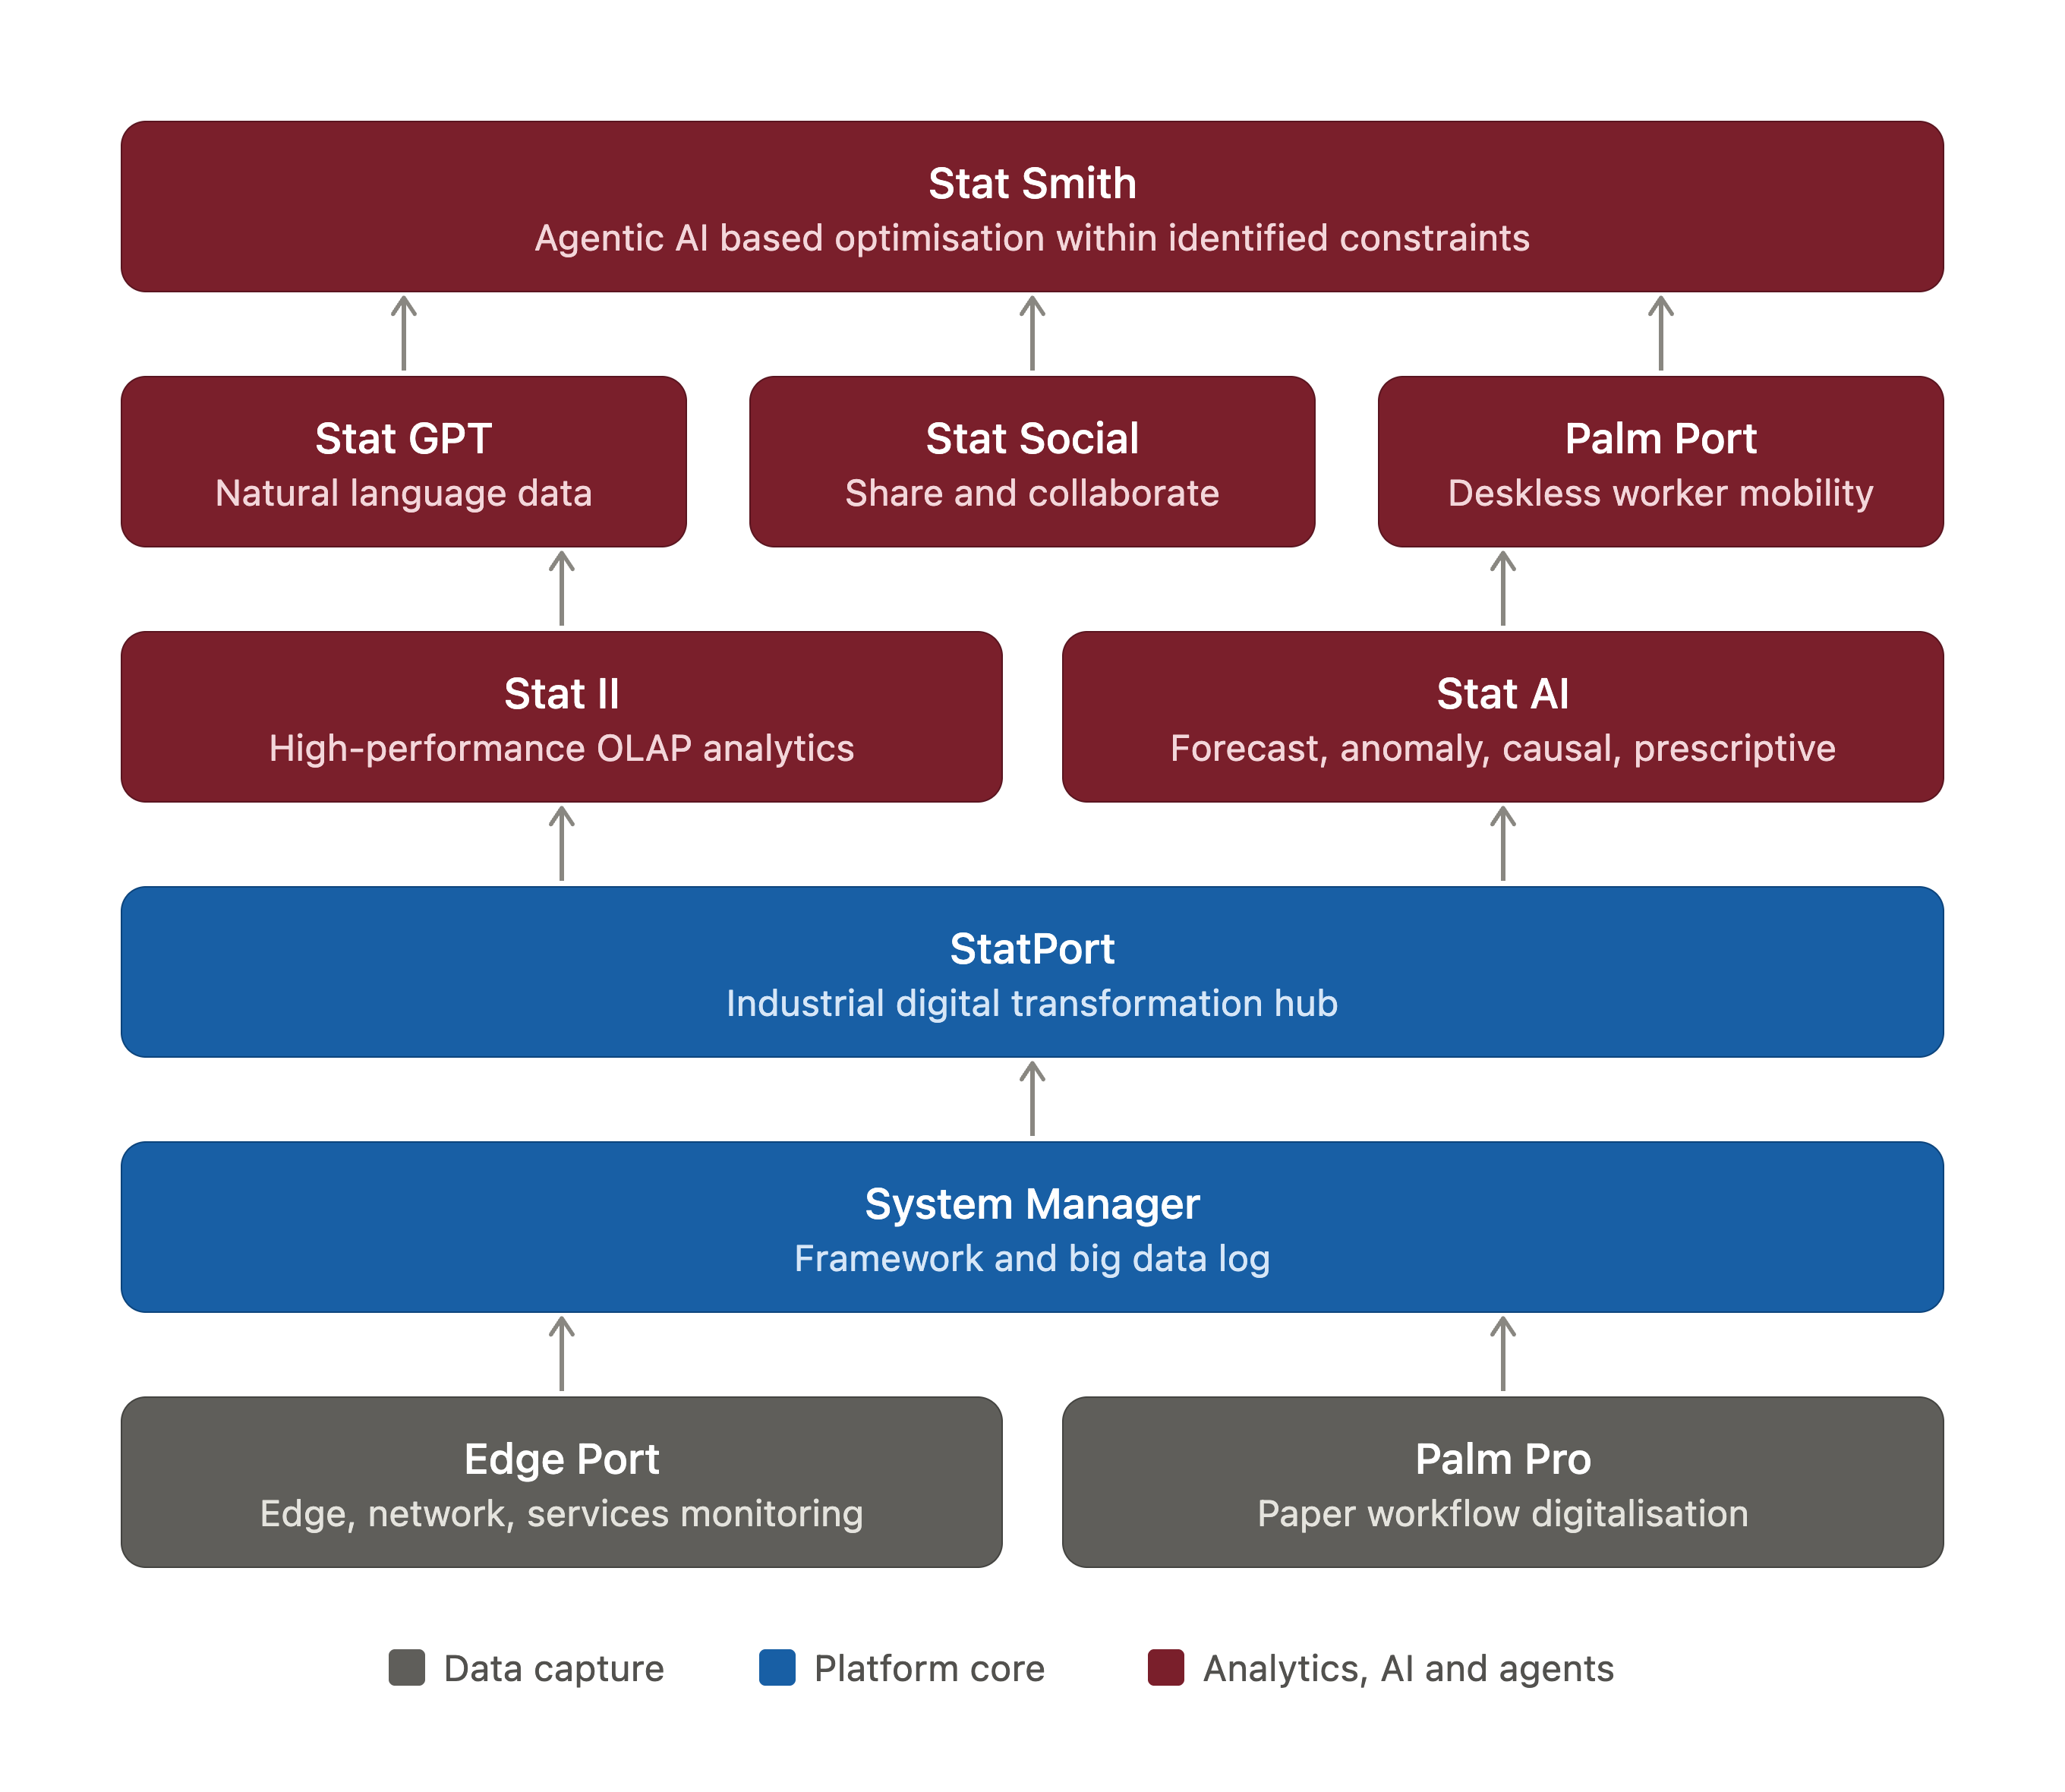
StatPort connects the operating loop through nine functional layers. The modular component map shows how data capture feeds the StatPort foundation, with analytics, mobility and agents above. Read the map from the bottom up, then follow the Connect, Act and Optimise stages.
Connect · layers 1–3
- Industrial edge — acquire data across industrial protocols.
- Digitalisation — replace paper logs with apps and workflows.
- IT–OT convergence — industrial logs, big data and search.
Act · layers 4–6
- Algorithms — monitoring, anomaly detection and actionable insight.
- Targeted alerts — deliver priorities with rule-based escalation.
- Outcome monitoring — reopen a ticket when the result is not sustained.
Optimise · layers 7–9
- Analytics and dashboards — review connected records with drill-down.
- Industrial AI — prediction, causality and prescription; pilot-ready.
- Optimisation — address losses and constraints in the value stream.
The nine functional layers explain the operating loop; the five-tier technology summary describes a different view of the platform. The component map illustrates relationships, not release status for every component. Industrial AI is pilot-ready.
CONNECTED THINKING
Keep exploring.
YOUR FACTORY. YOUR PRIORITIES.
Let’s connect your next step.
Start with your operating priorities. Explore the data, processes and people that can move them forward.