INTELLIGENCE & INSIGHTS
See the trend.
Know where to look next.
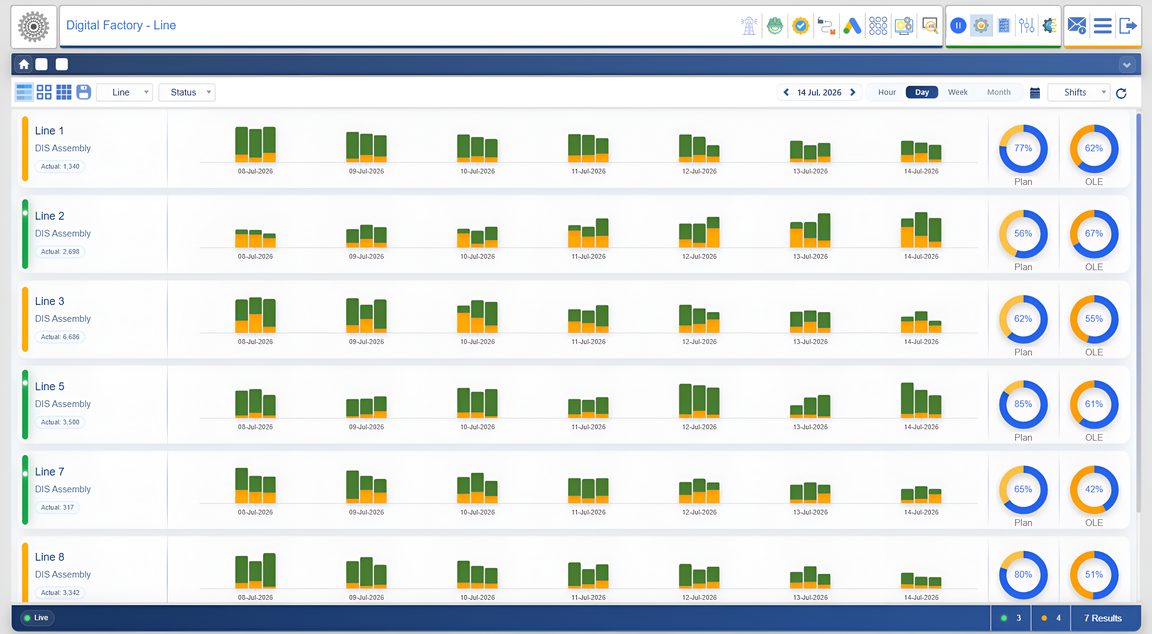
Stat II brings enterprise and edge data into a leadership cockpit. Compare operating performance, explore changing trends and take the review back to the production, quality or asset records behind the number.
CAPABILITIES
What it brings together.
01
One connected review
Bring indicators from different functions into a shared view, so output, quality and asset performance can be considered together.
02
Trends with context
Place current performance beside historical records. Examine the operation behind a change before deciding where to focus attention.
03
Detail behind the summary
Use analytical views and drill-down to move from an overview towards the relevant work centre, issue or operating record.
IN THE OPERATION
Build the dashboard around a decision.
A leadership review should end with a clear priority: investigate a recurring loss, examine a process trend or follow up an unresolved issue. Stat II draws on the converged StatPort data foundation, including equipment logs, digital documents, tickets and workflow outcomes. That connects the review to the work taking place on the shop floor.
- Review production, efficiency, effectiveness and quality in their operating context.
- Connect edge information with enterprise records rather than compare isolated reports.
- Explore performance over time and follow the detail behind an exception.
- Use the findings to guide the next investigation, task or management review.
A PRACTICAL APPROACH
Agree the measures before building the view.
Choose the questions each role needs answered, the source of each measure and the comparisons that make it useful. A common definition of a loss or a production outcome makes cross-functional reviews more meaningful. Start with a focused set of indicators, then connect the relevant detail and action records.
ROLE-SPECIFIC REVIEW
The same record. Different decisions.
For production and plant leadership
Stat II—the StatPort Intelligence & Insights capability, also called SII in the presentation—brings enterprise and edge data into dashboards. Read production trends, efficiency, effectiveness and quality in relation to the plant or line. The purpose is a clearer operating review, not a separate reporting exercise for each function.
For the next investigation
Keep the headline indicator connected to the relevant work centre, operation and underlying record. The supplied architecture describes drill-down analytical views over edge data, logs, tickets, workflow and outcomes. That connection helps the discussion move from what changed to where the team should investigate.
For the first dashboard
Choose a role and a recurring decision. Agree which measures, period and source records support it, and which action follows an exception. This is a suggested starting method: the assessment should establish the particular views and data relationships for the plant rather than assume a standard screen answers every need.
CONNECTED THINKING
Keep exploring.
YOUR FACTORY. YOUR PRIORITIES.
Let’s connect your next step.
Start with your operating priorities. Explore the data, processes and people that can move them forward.