MEASURE / INVESTIGATE / VERIFY
Keep quality evidence
connected to the action.
Bring digital quality plans, measurement data, statistical analysis and corrective actions into one working process. Trace an observation from the inspection record to the investigation and the evidence of a sustained response.
CAPABILITIES
What it brings together.
01
Capture consistently
Use version-controlled check sheets, sampling plans and calendars. Connect measurements from air gauges, handheld instruments and coordinate measuring machines (CMMs).
02
Understand variation
Review process stability and capability using statistical process control (SPC). Connect charts and measurements with the product, batch and process stage.
03
Follow corrective action
Allocate corrective and preventive action (CAPA), investigate causes and monitor the result. Keep the evidence available when the same issue is reviewed again.
IN THE OPERATION
Build a complete quality loop.
Quality information crosses incoming inspection, in-process checks, semi-finished goods and end-of-line approval. A connected record preserves the identity of the measurement and what happened next. StatPort brings those records together with rework, rejection and approval activity, helping teams examine recurring issues within the process that produced them.
- Quality plans with document change management, versions and searchable archives.
- Connected measurement capture with barcode, QR, RFID or BLE identification.
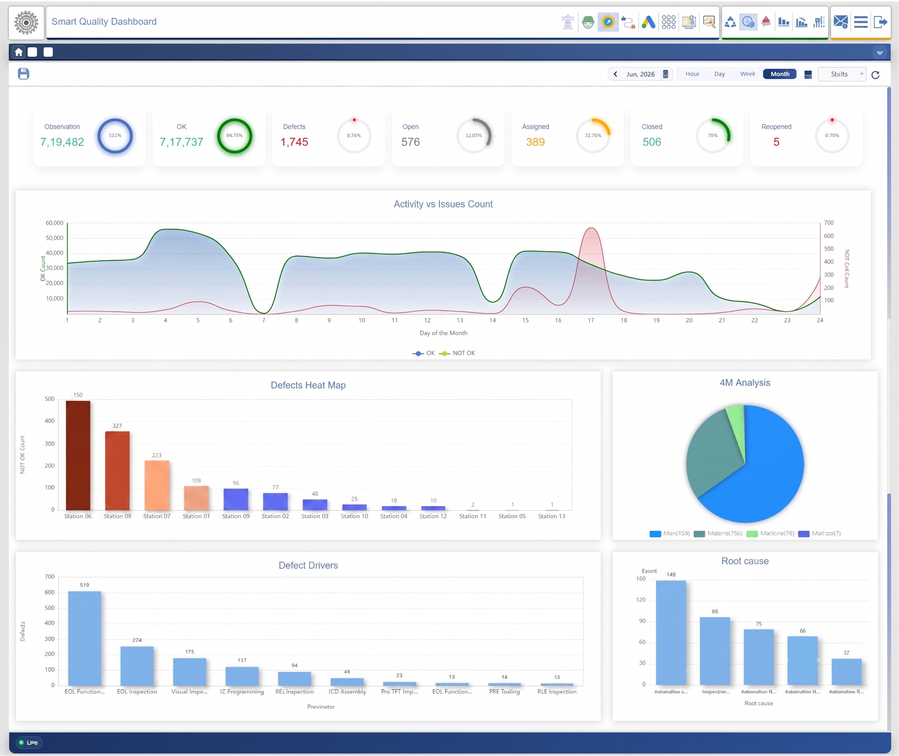
- Cause investigation through 4M: man, machine, material and method.
- Corrective-action allocation, follow-up and monitoring of sustained results.
A PRACTICAL APPROACH
Begin with one inspection and its response.
Map how a measurement is captured, how an issue is identified and who investigates it. Include document changes and evidence of closure. Digitalising that whole loop gives the quality team a practical foundation for extending statistical control and traceability across more processes.
FROM INSPECTION TO ASSURANCE
Build a quality record that survives the handover.
Capture with the right context
The source material covers digital check sheets, quality plans, change control, calendars and searchable archives. Measurements may come from connected air gauges, handheld instruments or CMMs, alongside human input. Keep the component, process stage and applicable plan connected to the reading.
Investigate with evidence
Smart Quality includes stability and capability review, Cp and Cpk, defect views and 4M analysis. PLC and SCADA integration adds process context. These views help the quality team identify where to investigate; they do not replace an agreed inspection plan or automatically prove a root cause.
Verify the action
CAPA is tracked for sustainability, with the supporting operating record retained. Define who investigates, who authorises the response and what follow-up evidence establishes effectiveness. Start with one incoming, in-process or end-of-line routine and test the whole loop before extending it.
PROCESS MONITORING · QUALITY REVIEW
See the ticket and the wider pattern.
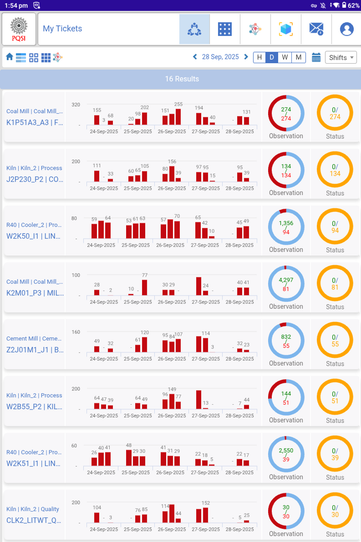
Smart Quality combines digital check sheets, statistical control, process monitoring and telemetry. A process-monitoring ticket is the operating entry point; the quality dashboard brings issues, 4M analysis and root-cause views together for review. CAPA is tracked for sustainability rather than treated as a one-time closure.
CONNECTED THINKING
Keep exploring.
YOUR FACTORY. YOUR PRIORITIES.
Let’s connect your next step.
Start with your operating priorities. Explore the data, processes and people that can move them forward.