PILOT-READY INDUSTRIAL AI
Investigate the pattern.
Prioritise the response.
Stat AI is a pilot-ready suite of machine-learning and deep-learning models for industrial use cases. Explore forecasts, unusual behaviour, possible causes and recommended responses using connected production, quality, yield and maintenance data.
CAPABILITIES
What it brings together.
01
Forecast and predict
Examine historical behaviour and future risk. Downtime forecasts and maintenance-risk views help frame the next investigation and planning discussion.
02
Find unusual behaviour
Bring multiple analytical methods to anomaly detection. Review the signal, its confidence and the operating context before selecting a response.
03
Explore causes and priorities
Connect analytical findings with root-cause records and maintenance history. Use the evidence to compare possible causes and direct specialist attention.
IN THE OPERATION
An industrial model needs an industrial record.
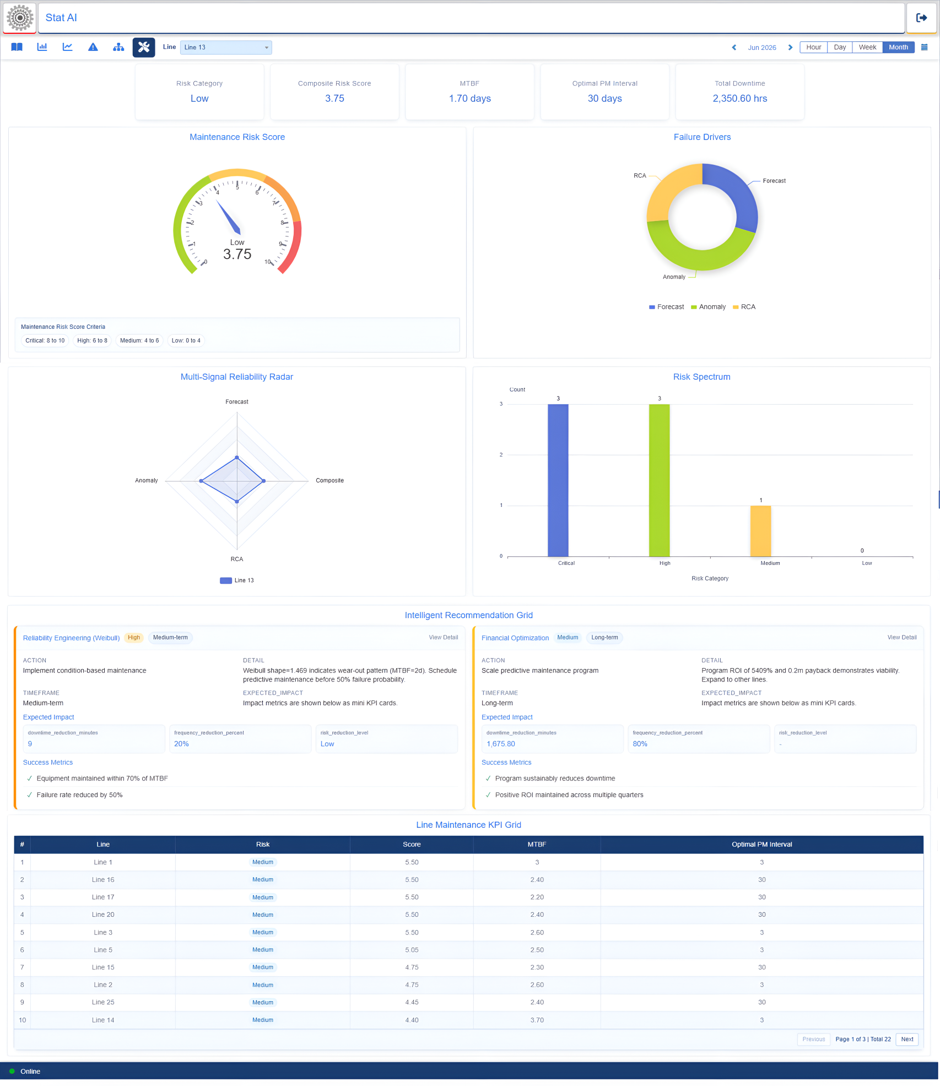
The same reading can mean different things for a different product, shift, workload or equipment state. Stat AI works with the converged data foundation beneath StatPort, connecting analytical results to the operation they describe. The maintenance views bring forecast, anomaly and root-cause signals together to support a more focused review.
- Forecasting for a defined production or maintenance question.
- Anomaly detection across production, quality, yield and maintenance records.
- Root-cause investigation supported by operating and failure-mode evidence.
- Maintenance priorities informed by condition, usage and service history.
A PRACTICAL APPROACH
Set a useful pilot before judging a model.
Choose one question, confirm the data available and agree how the result will be evaluated. Include the people who will investigate the signal and act on it. A focused pilot should test the quality of the output, the effort required to review it and its usefulness in the actual operating process.
FOUR ANALYTICAL VIEWS
From a changing pattern to a focused investigation.
Forecast and detect
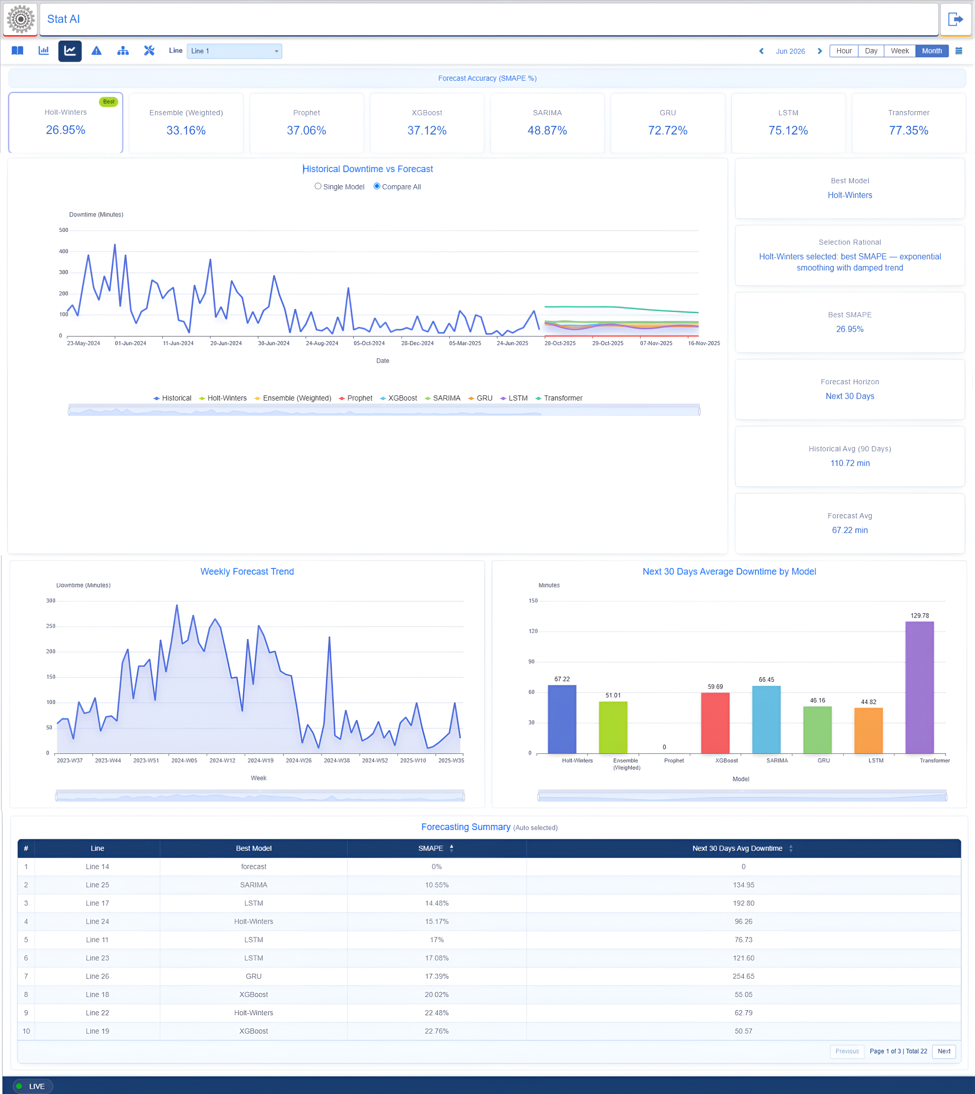
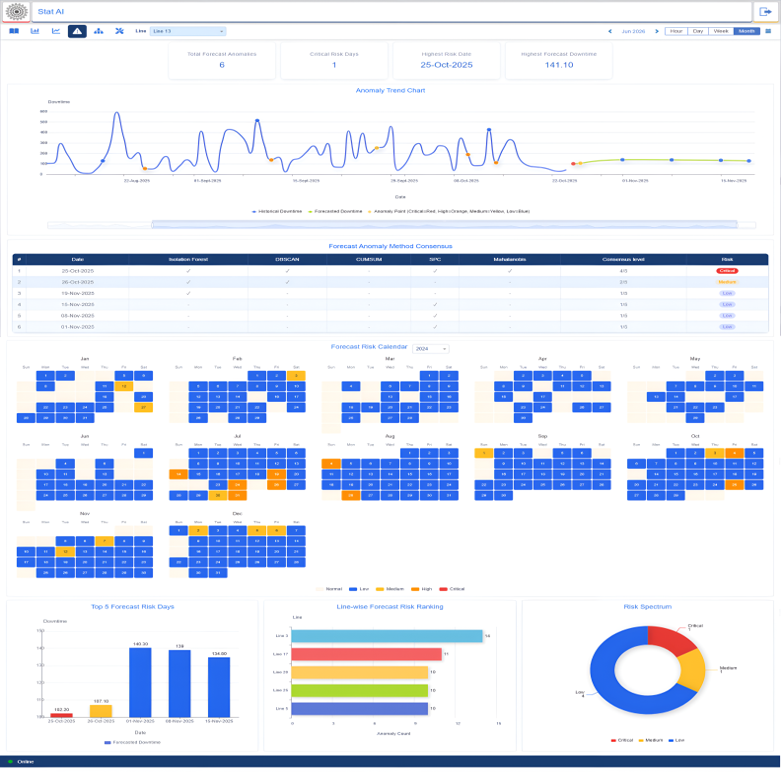
The supplied Stat AI screens compare forecasting models and show historical and forecast downtime. Anomaly views bring method agreement and a risk calendar into the review. These screens demonstrate how results are presented; the usefulness and confidence of a particular model must be evaluated on the plant’s relevant records.
Investigate the likely contributors
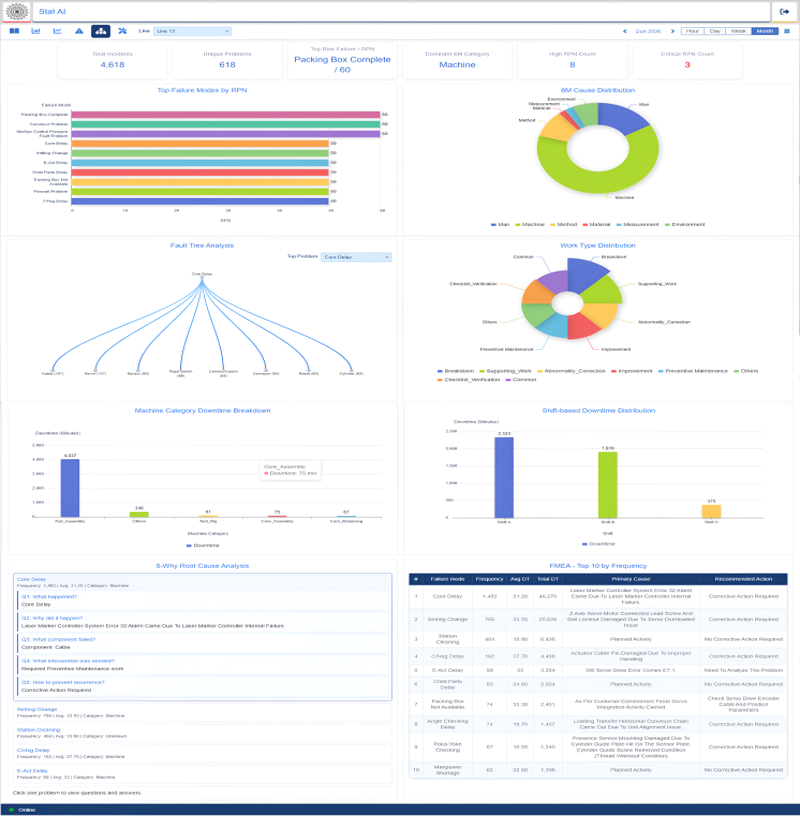
Root-cause views organise failure modes, risk-priority analysis, 6M causes, fault trees and five-why records. They help structure an engineer’s investigation. A suggested cause is not treated as proven merely because it appears on a screen; the responsible team reviews the operating evidence.
Define a pilot with an owner
The presentation labels Industrial AI as pilot-ready. Select a downtime, quality or production question, identify its source history and name the person who will review the output. Agree the response and assessment criteria before expanding. No universal accuracy, savings or autonomous operating outcome is assumed.
FOUR CONNECTED VIEWS
From downtime data to the next decision.
Four connected views bring downtime data into the investigation. Forecasting compares eight models per line; anomaly detection combines five methods; root-cause analysis organises failure modes and causes; predictive maintenance brings the signals into a risk and recommendation view.
Read the forecasting summary alongside the anomaly, root-cause and maintenance views. Each view addresses a different question: what may happen, which pattern needs attention, what may be contributing and which intervention should be considered.
Industrial AI is pilot-ready. The screens illustrate the product interface; displayed values are not evidence of forecast accuracy or customer results. Application scope and data readiness are established for each pilot.
CONNECTED THINKING
Keep exploring.
YOUR FACTORY. YOUR PRIORITIES.
Let’s connect your next step.
Start with your operating priorities. Explore the data, processes and people that can move them forward.